River Cities Senior Management Compensation Survey – 2004
Attached are the results of the 2004 River Cities Capital Funds Senior Management Compensation Survey. Twenty-eight private growth companies from the IT-enabled business services, technology and healthcare sectors participated in this year’s survey. Firms provided data on compensation components – cash and stock – for senior management. Data was collected between October and November 2004, with compensation, company head count and trailing twelve months (TTM) revenue noted as close to September 2004 as possible.
The salary survey data is illustrated in the five attached exhibits. The first numerical summary presents the main “dashboard” of the report. Each of the graphical exhibits (2 to 5) presents the raw data observed, accompanied by a calculated trend line1.
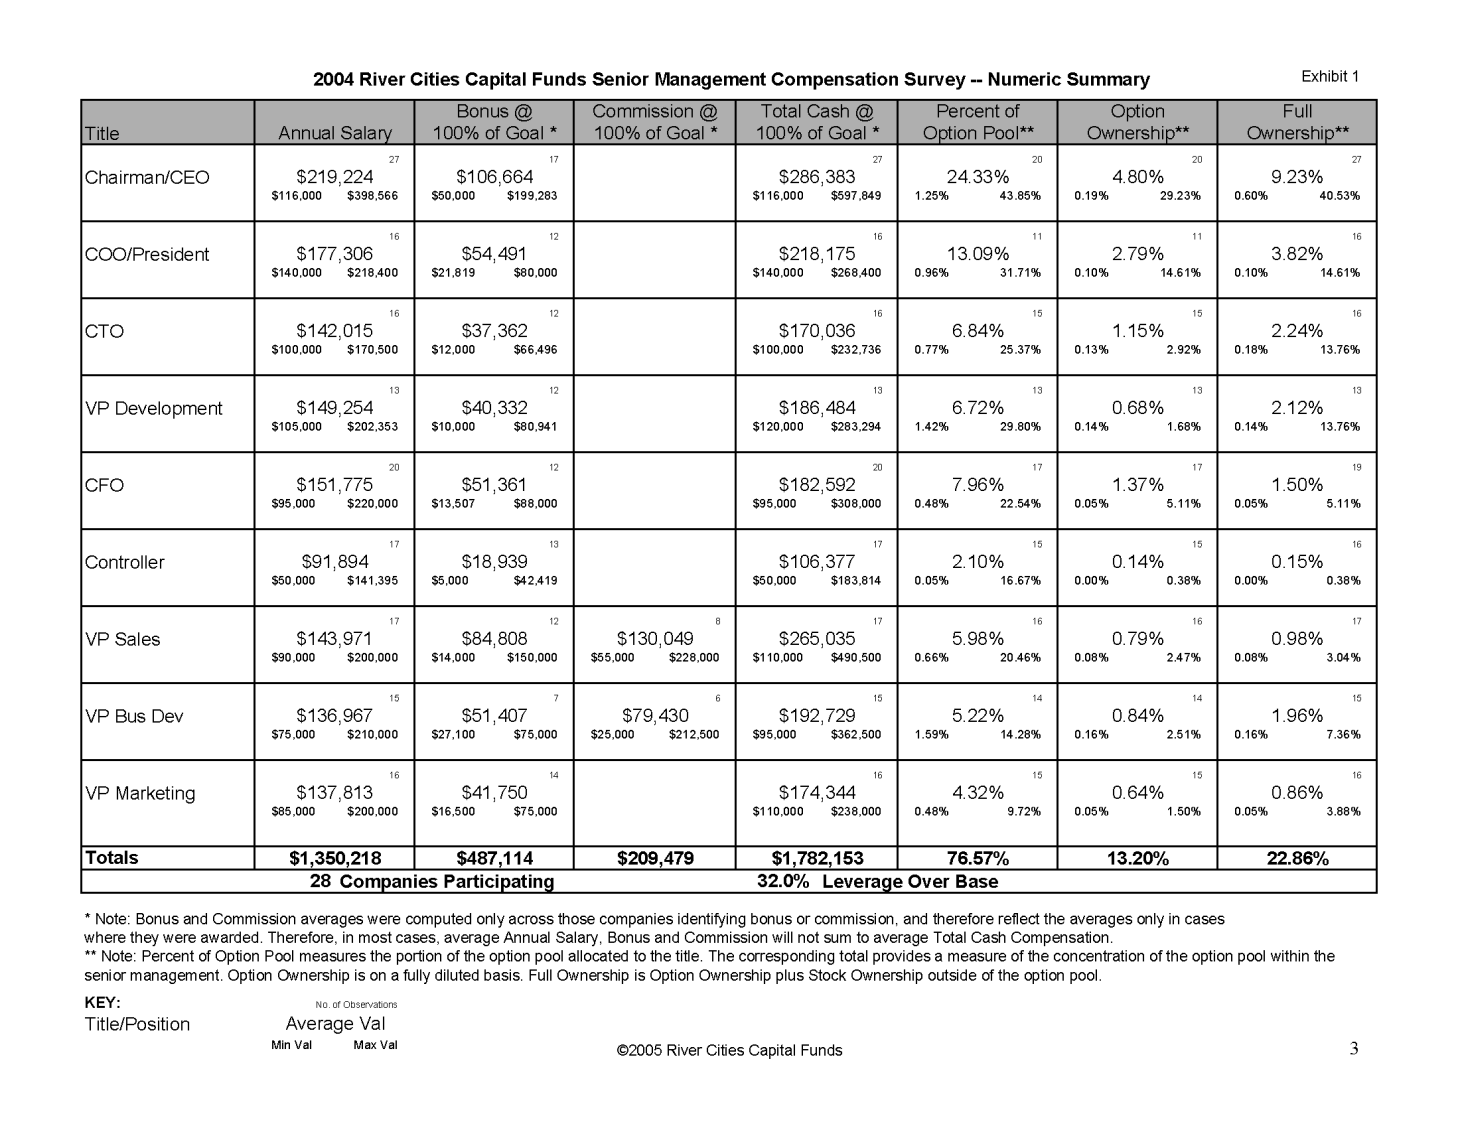
Exhibit 1 – Numeric Summary.
Here are just a few interesting observations from the Summary:
-
- On average, CEOs have a base salary of $220K, bonus of $107K at target and 5.7% in options (or 24% of all options granted).
- Bonuses and commissions provided an average of 32% leverage over base salaries for the average management team.
- On average, option pools accounted for 17% of fully-diluted ownership.
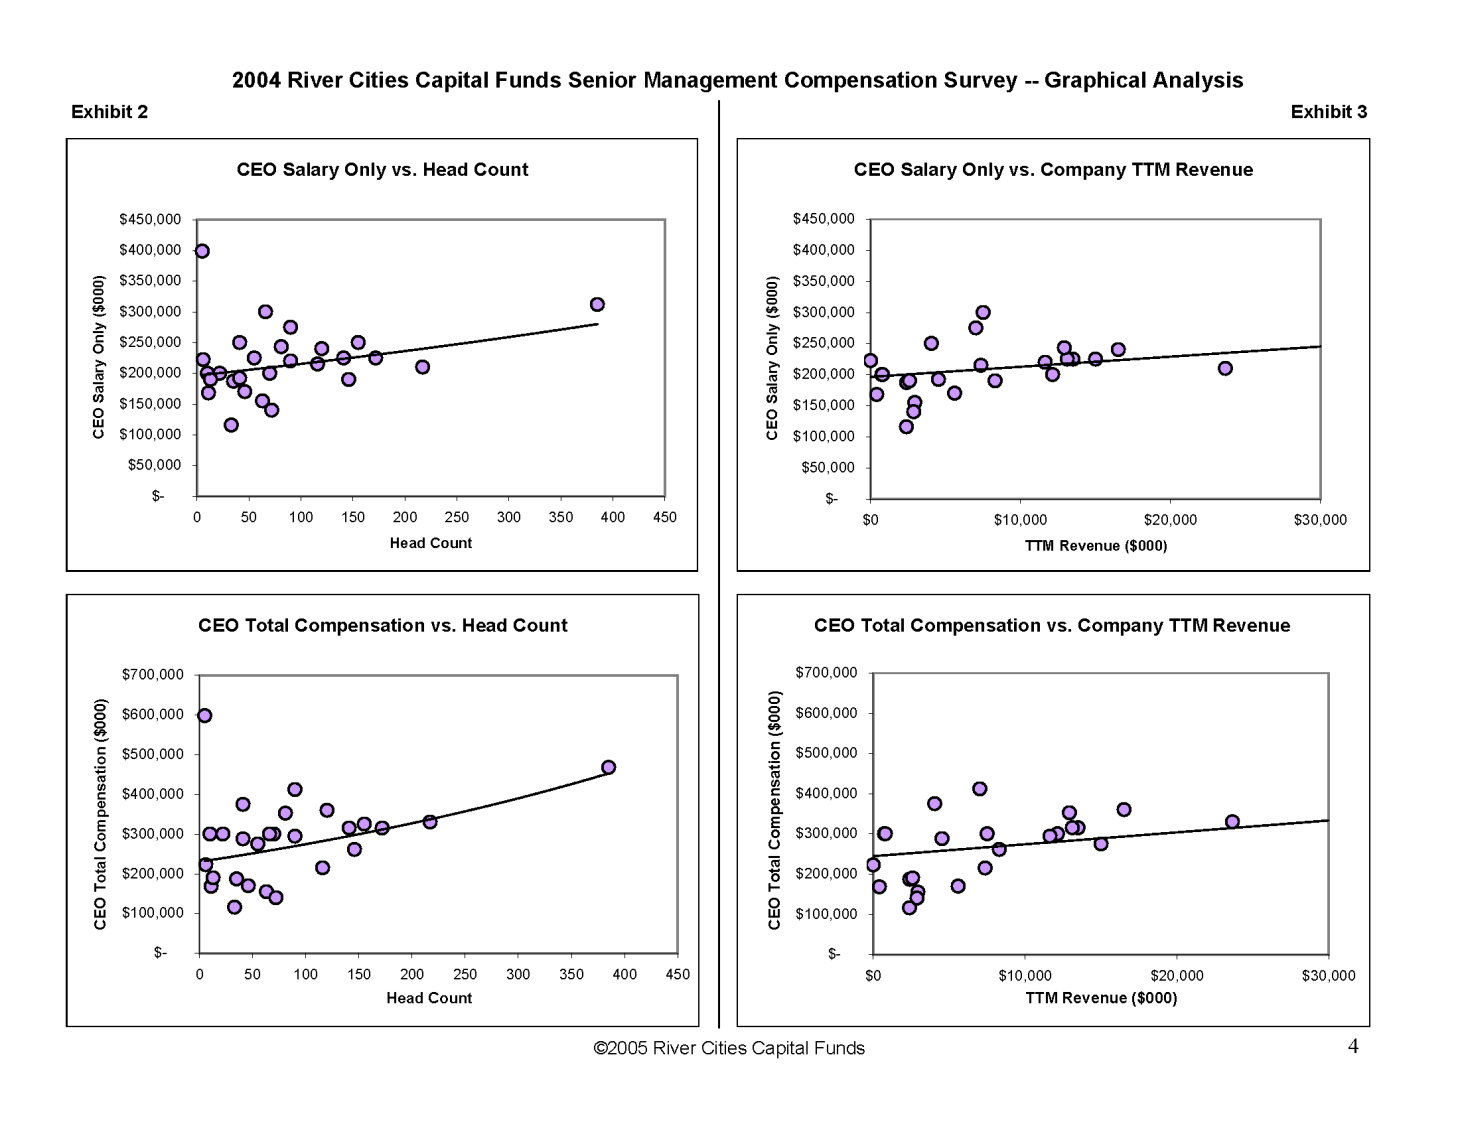
Exhibit 2 – “CEO Compensation versus Company Head Count” Graph.
The analysis showed that CEOs who manage more people tend to receive more compensation, but not dramatically so.
Exhibit 3 – “CEO Compensation versus Company TTM Revenue” Graph.
The analysis showed that CEOs who run companies with more revenue tend to receive more compensation, but similar to the comparison to headcount, the relationship was weak.
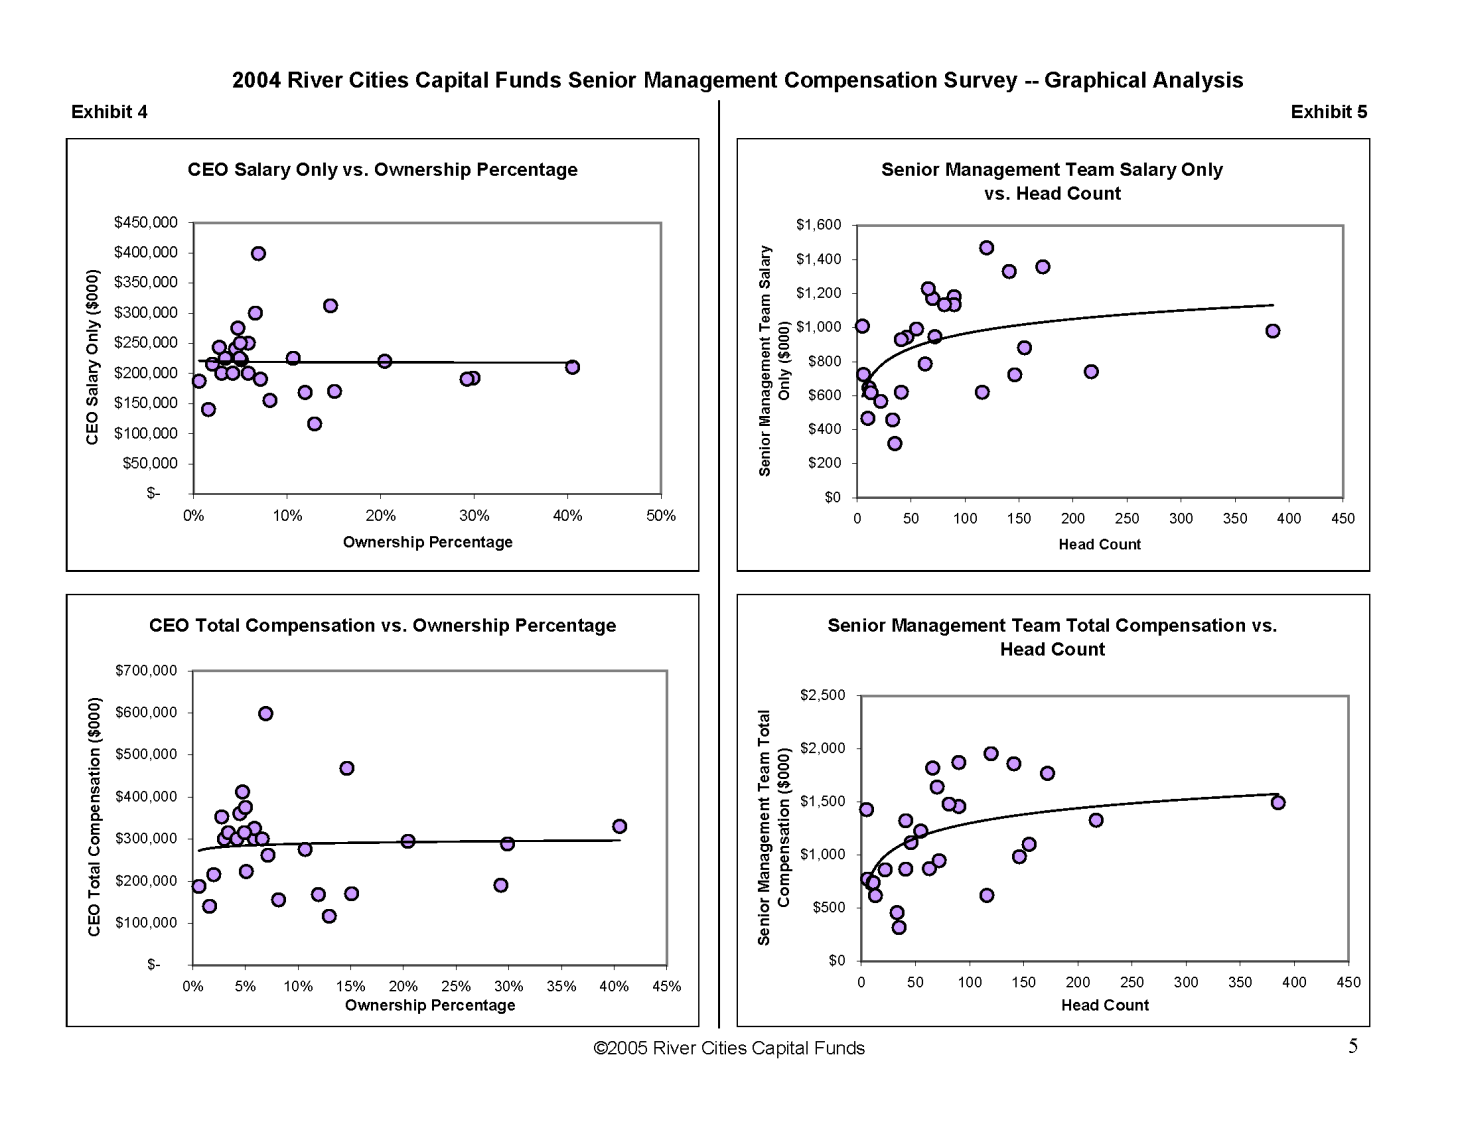
Exhibit 4 – “CEO Compensation versus Ownership Percentage” Graph.
The analysis showed a surprising lack of correlation between compensation and ownership stake; the intuitive hypothesis that CEOs who make less money should have more options and stock to provide an incentive does not seem to hold up.
Exhibit 5 – “Senior Management Compensation versus Company Head Count” Graph.
The analysis showed a very weak relationship between size of the company (measured by revenue) and the compensation of management teams taken as a whole; it appears that some teams are leaner or just work for less than some other teams at companies of similar size.
When we have a significant number of exits from companies that participated in this survey in prior years, we will test for any relationship between compensation practices and growth in equity value.
For further information about this report, please contact Sid D’Souza of River Cities Capital Funds at
(513) 621-9700 or sdsouza@rccf.com; the report can be accessed online from the “Downloads” section of the River Cities Capital Funds website, http://www.rccf.com
An exponential curve trend line was fit to each data set using the Least Squares Method. Correlation was described by R- squared values: very weak (0.01-0.2), weak (0.21-0.4), moderate (0.41-0.6), strong (0.61-0.8) and very strong (0.81-1.0).