River Cities Senior Management Compensation Survey – 2006/2007
Attached are the results of the 2006-07 River Cities Capital Funds Senior Management Compensation Survey. Thirty private growth companies from the IT and healthcare sectors participated in this year’s survey. Firms provided data on compensation components – cash and stock – for senior management. Data was collected between September-October 2007, with compensation, company head count and trailing twelve months (TTM) revenue noted as close to June 2007 as possible.
The salary survey data is illustrated in the five attached exhibits. The first numerical summary presents the main “dashboard” of the report, with confidential information on which companies were the highest and lowest in the listed compensation categories. Each of the graphical exhibits (2 to 5) presents the raw data observed, accompanied by a calculated trend line1.
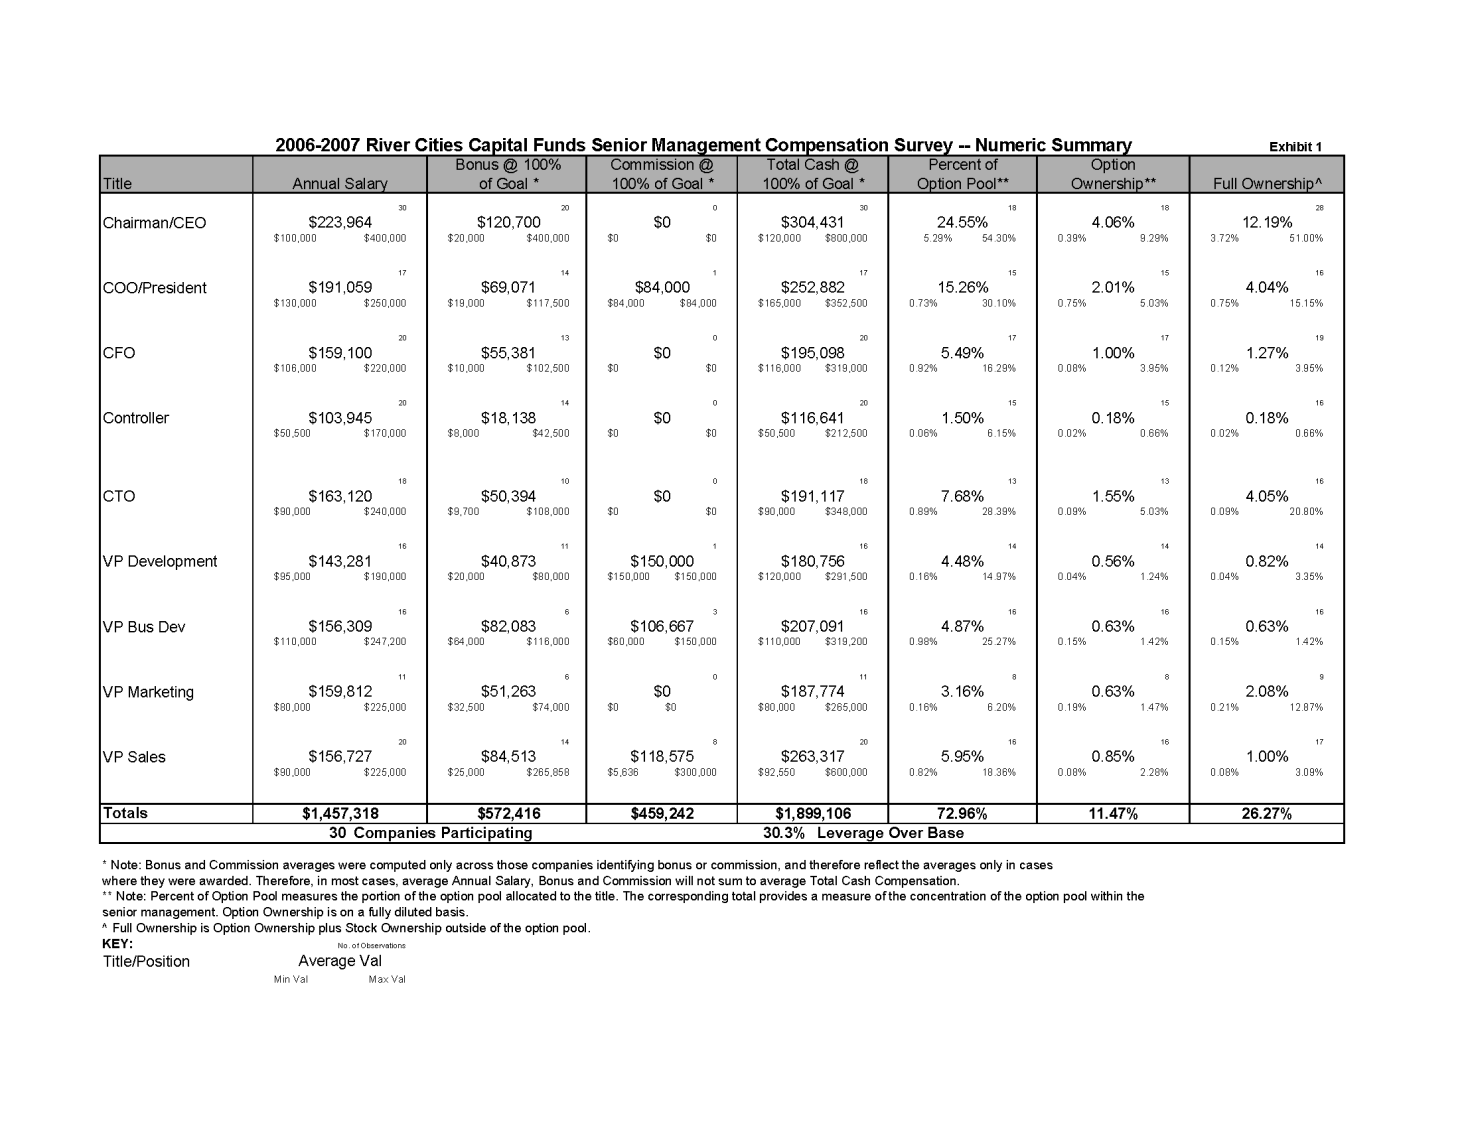
Exhibit 1 – Numeric Summary.
Here are just a few interesting observations from the Summary:
-
- On average, CEOs have a base salary of $223K, bonus of $120K and 4.1% in options (or 24% of all options granted).
- Bonuses and commissions provided an average of 30% leverage over base salaries for the average management team.
- On average, option pools accounted for 11% of fully-diluted ownership.
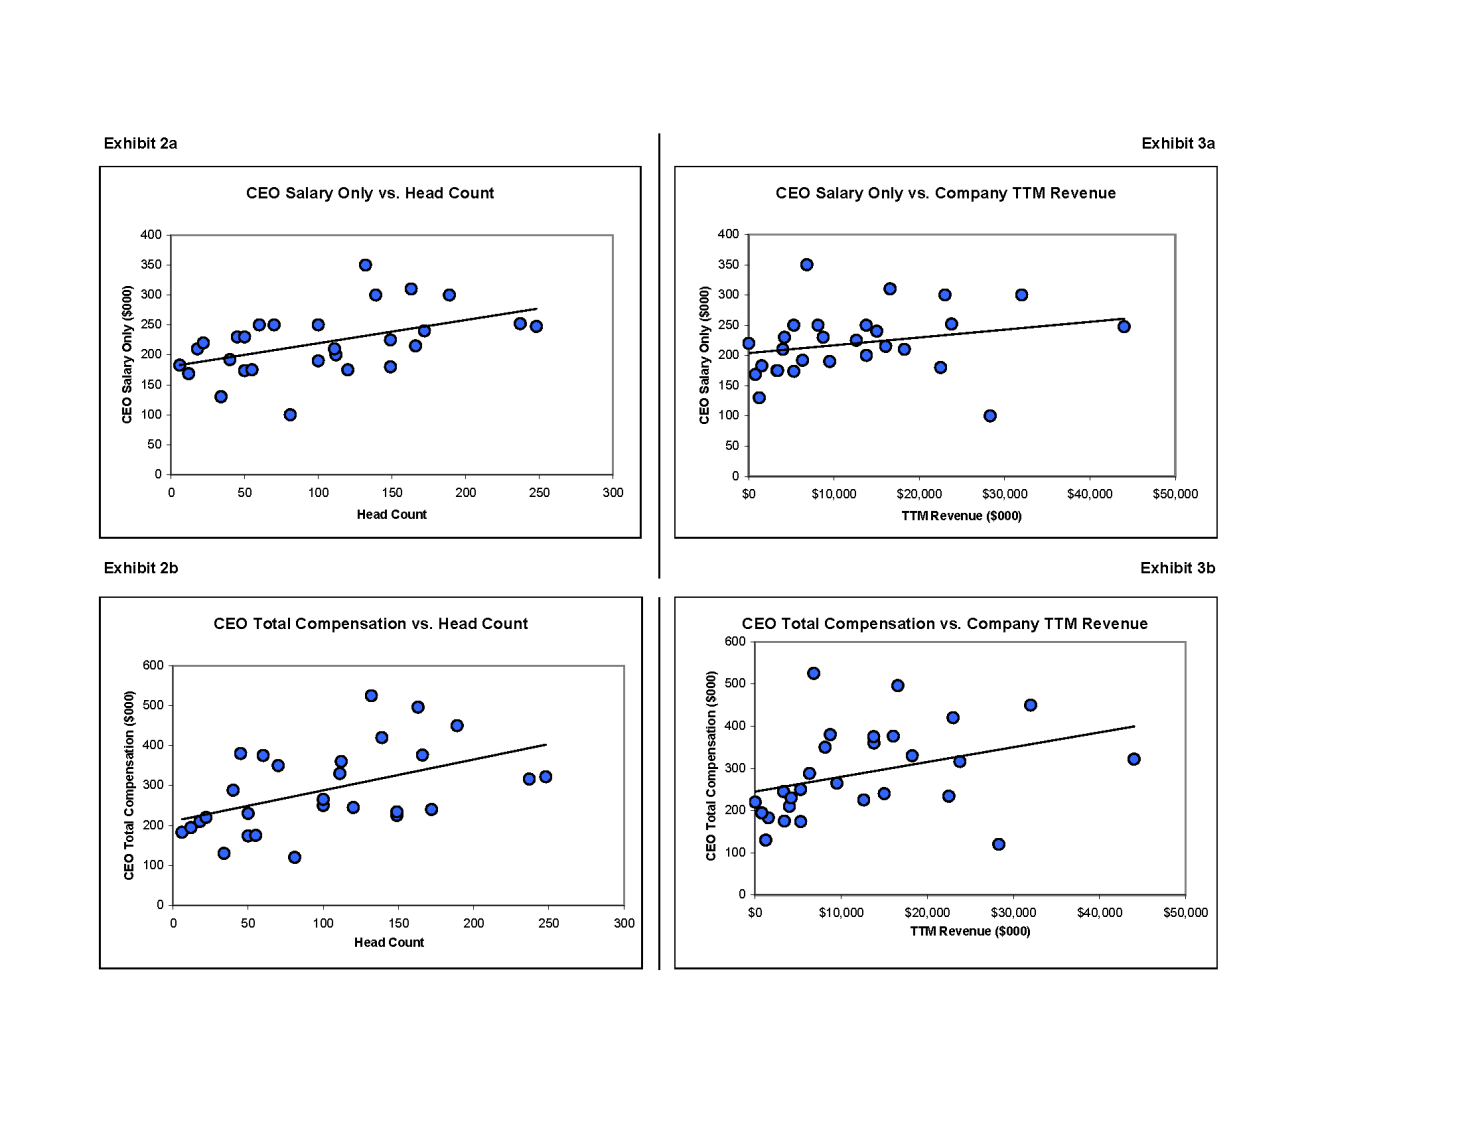
Exhibit 2 – “CEO Compensation versus Company Head Count” Graph.
The analysis showed that CEOs who manage more people tend to receive more salary, but not dramatically so. The correlation was very weak when CEOs total compensation was compared with the Head Count
Exhibit 3 – “CEO Compensation versus Company TTM Revenue” Graph.
The analysis showed that CEOs who run companies with more revenue tend to receive more compensation, but similar to the comparison to headcount, the relationship was weak.
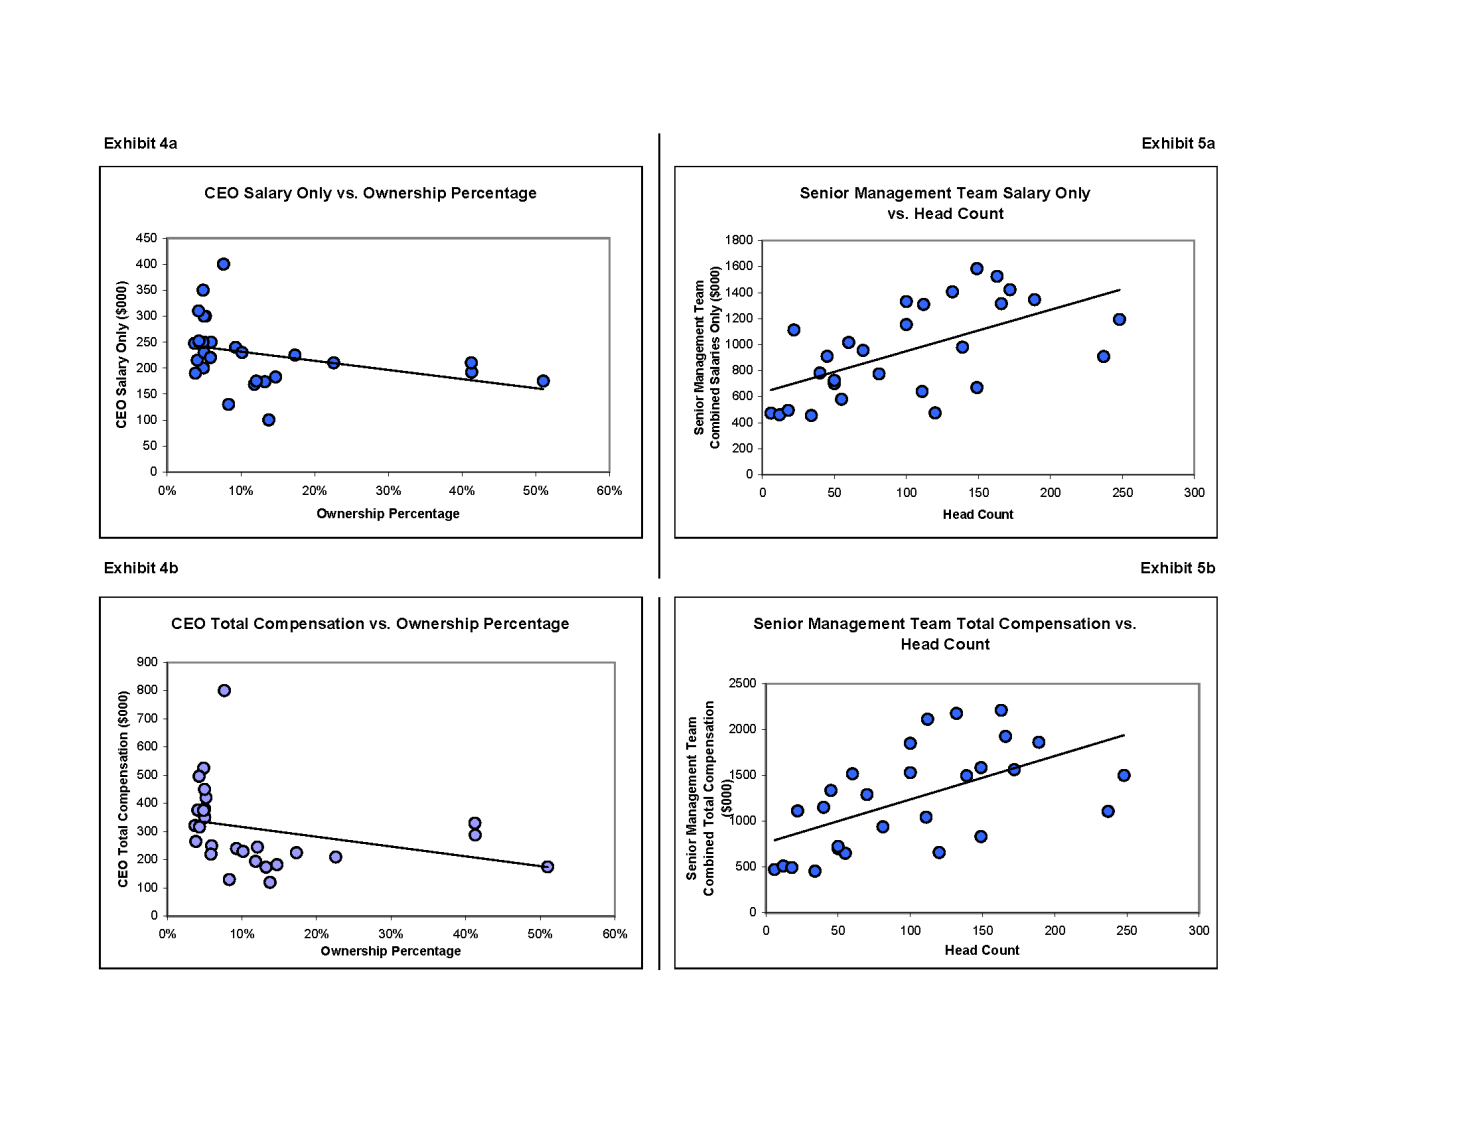
Exhibit 4 – “CEO Compensation versus Ownership Percentage” Graph.
The analysis showed that CEO’s who have lesser compensation have more ownership in the company; however the relationship was very weak.
Exhibit 5 – “Senior Management Compensation versus Company Head Count” Graph.
The analysis showed a weak relationship between size of the company (measured by Head Count) and the compensation of management teams taken as a whole.
For further information about this report, please contact Parag Rathi; more detailed analysis is available for interested managers.
1 A linear trend line was fit to each data set.