River Cities Senior Management Compensation Survey – 2002
Attached are the results of the 2002 River Cities Capital Funds Senior Management Compensation
Survey. Twenty technology firms participated in this year’s survey, providing data on company
revenues and compensation components (cash and stock) for senior management. Data was
collected between February and April of 2002, with valuations and trailing twelve months (TTM)
revenue noted as close to December 2001 as possible.
This report provides a numeric summarization of the data collected, combined with a graphical
summary of key variables and trends within the data.
It was found that, in general, the data adhered to expected results.
- As the sizes of the companies (as measured by valuation and TTM revenues) increased, CEO compensation increased.
- As CEO ownership percentage increased, the level of cash compensation decreased.
- As company valuation increased, the aggregate salary of the senior management team increased.
The trends were not as pronounced in the data set as might have been expected, most likely due to the natural variance observed in early stage portfolio companies.
The data from the salary survey is collected in five exhibits, attached. Each of the graphical exhibits (2 to 5) presents the raw data observed, accompanied by a calculated trend line.
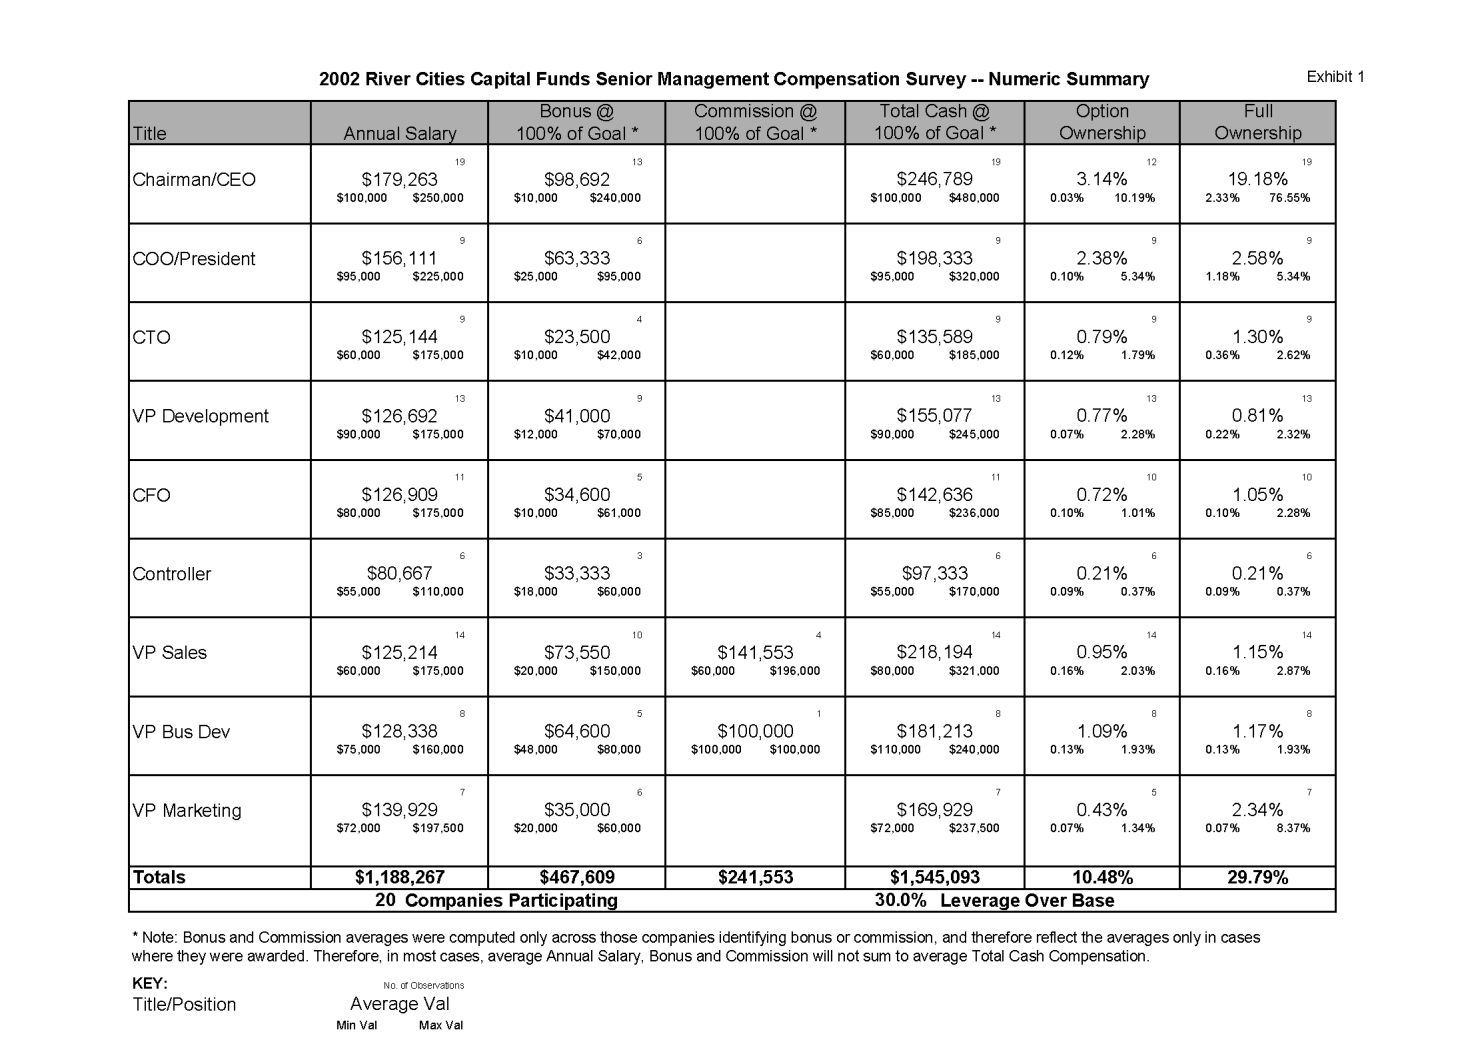
Exhibit 1 – Numeric Summary.
This matrix shows the average compensation for each of the nine standard management positions, broken down by cash and ownership components. Additionally, for each of the compensation components of each of the management positions, the matrix includes the range and number of observations. A key at the bottom of the page describes the layout of the data.
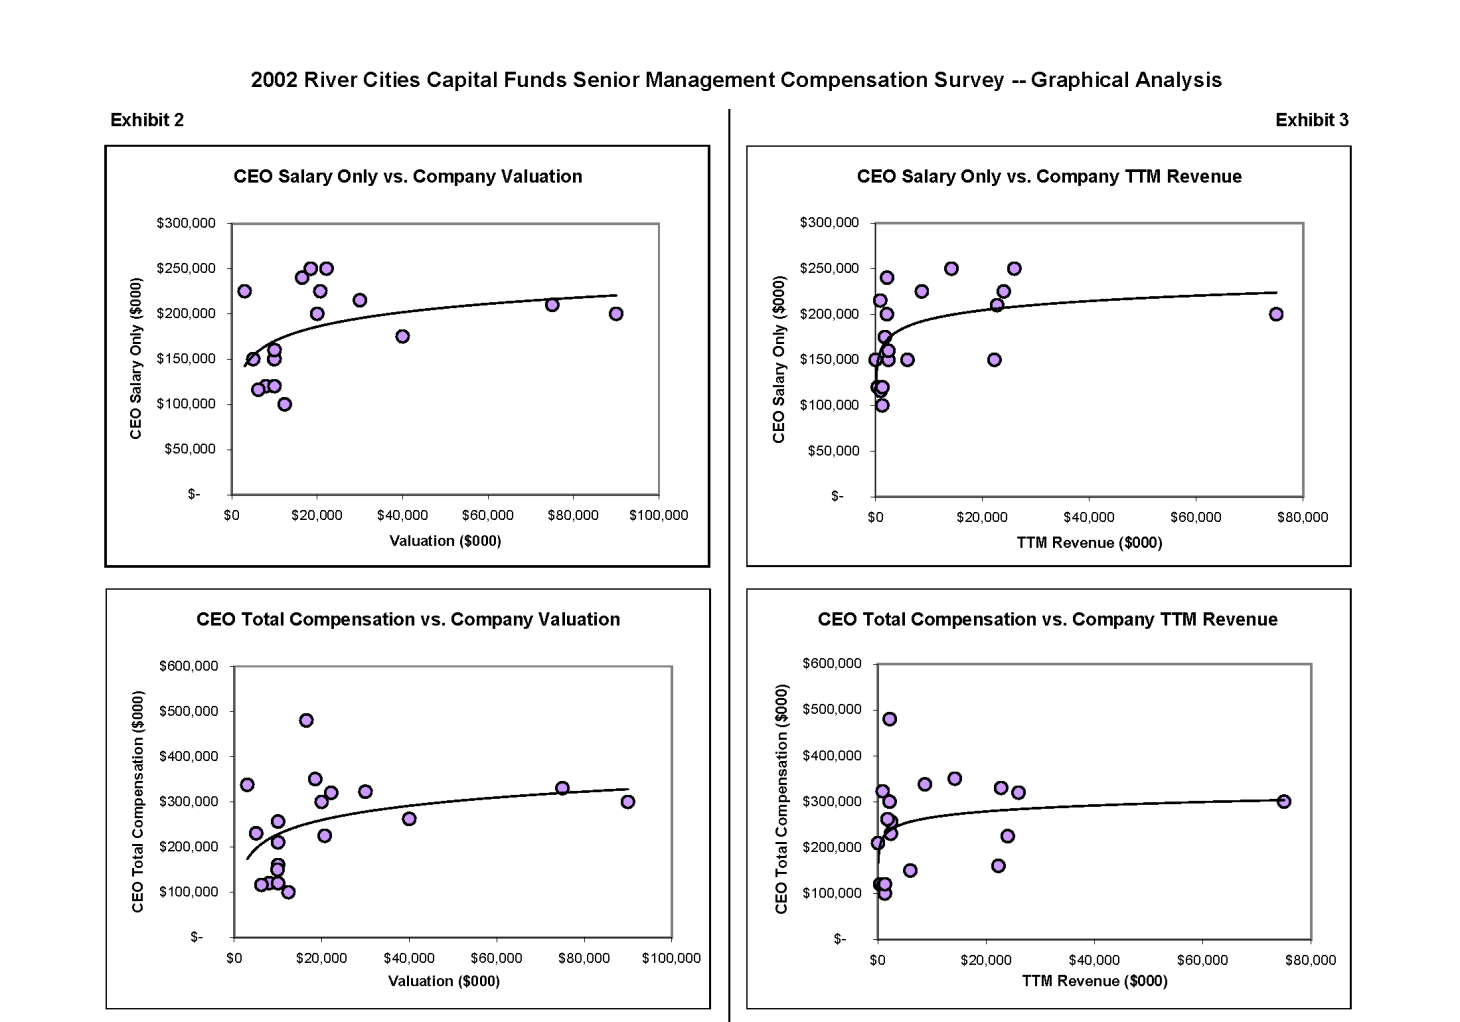
Exhibit 2 – Graphs: CEO Compensation versus Company Valuation.
These two graphs show the CEO Base Salary component and the CEO Total Cash Compensation as a function of Company Valuation. The data conforms to the expectation that salary and compensation increase for companies with higher valuations.
Exhibit 3 – Graphs: CEO Compensation versus Company TTM Revenue.
These two graphs show the CEO Base Salary component and the CEO Total Cash Compensation as a function of Company TTM (Trailing Twelve Months) Revenue. The data conforms, loosely, to the expectation that salary and compensation increase for companies with higher revenues.
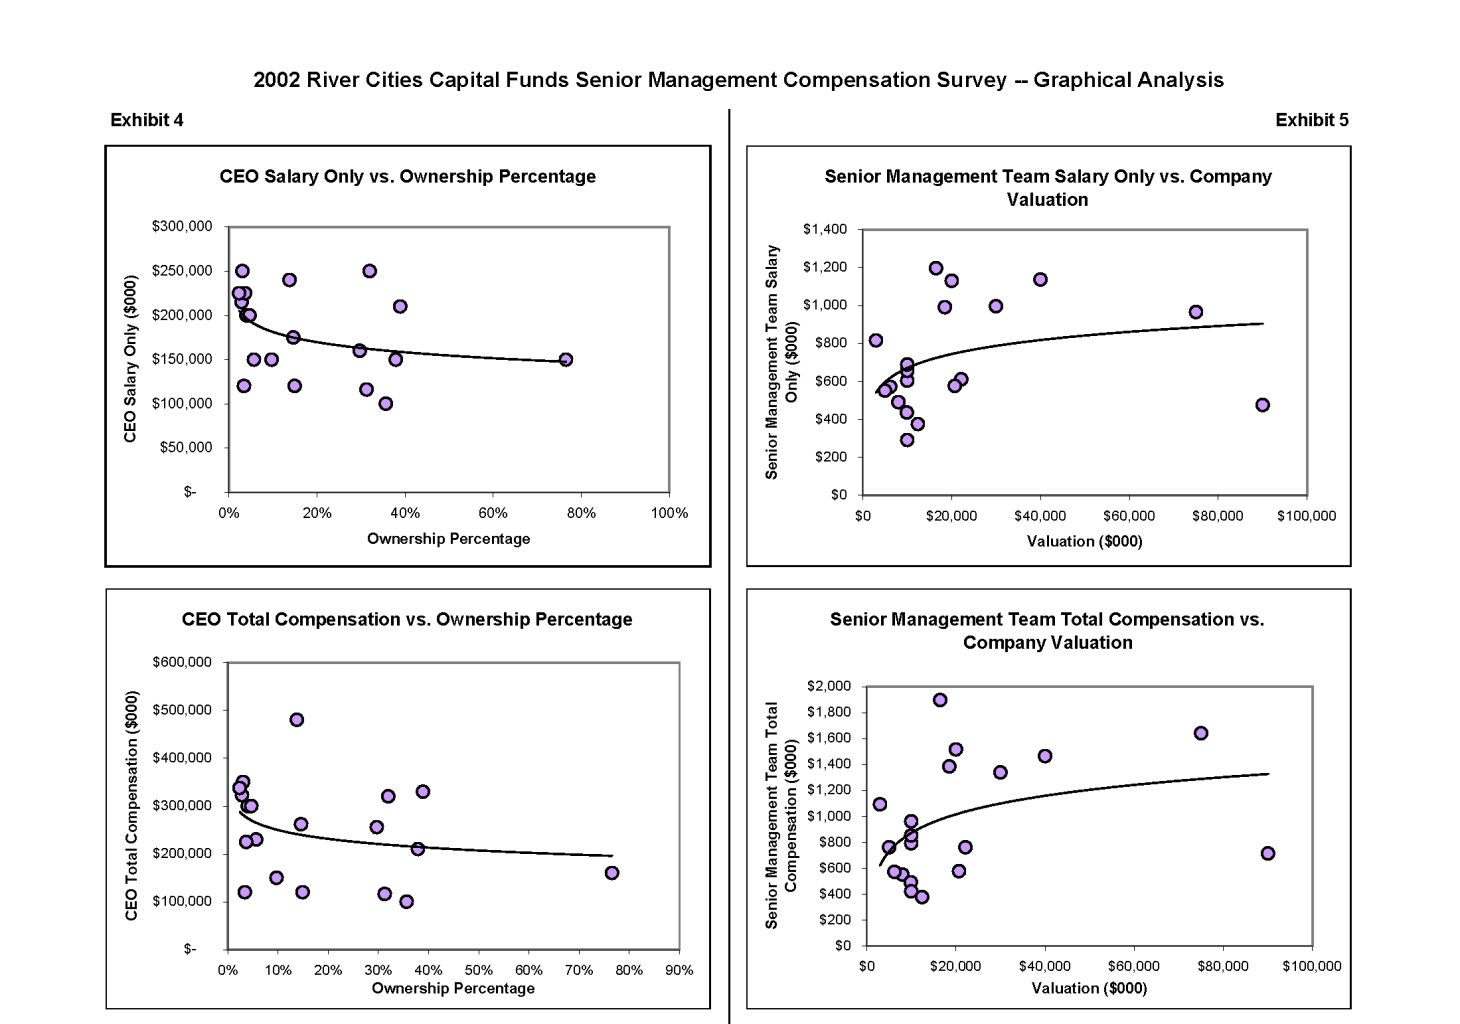
Exhibit 4 – Graphs: CEO Compensation versus Ownership Percentage.
These two graphs show the CEO Base Salary component and the CEO Total Cash Compensation as a function of Ownership Percentage. The data conforms to the expectation that salary and compensation decrease for CEOs with higher ownership percentages of their companies.
Exhibit 5 – Graphs: Senior Management Compensation versus Company Valuation.
These two graphs show the Senior Management Team Base Salary component and the Senior Management Team Total Cash Compensation as a function of Company Valuation. The data conforms to the expectation that salary and compensation increase for senior management teams at companies with higher valuations.
For further information about this report, please contact Sid D’Souza at River Cities Capital Funds at (513) 621-9700 or sdsouza@rccf.com, http://www.rccf.com