River Cities Senior Management Compensation Survey – 2010
Attached are the results of the 2010 River Cities Capital Funds Senior Management Compensation Survey. Twenty five private growth companies from the IT and healthcare sectors participated in this year’s survey. Firms provided data on compensation components – cash and stock – for senior management and independent directors. In addition, data was collected with respect to D&O insurance and audit expenses. Data was collected between May-June 2011, with compensation, company head count and trailing twelve months (TTM) revenue noted as close to December 2010 as possible. The survey data is illustrated in the seven attached exhibits.
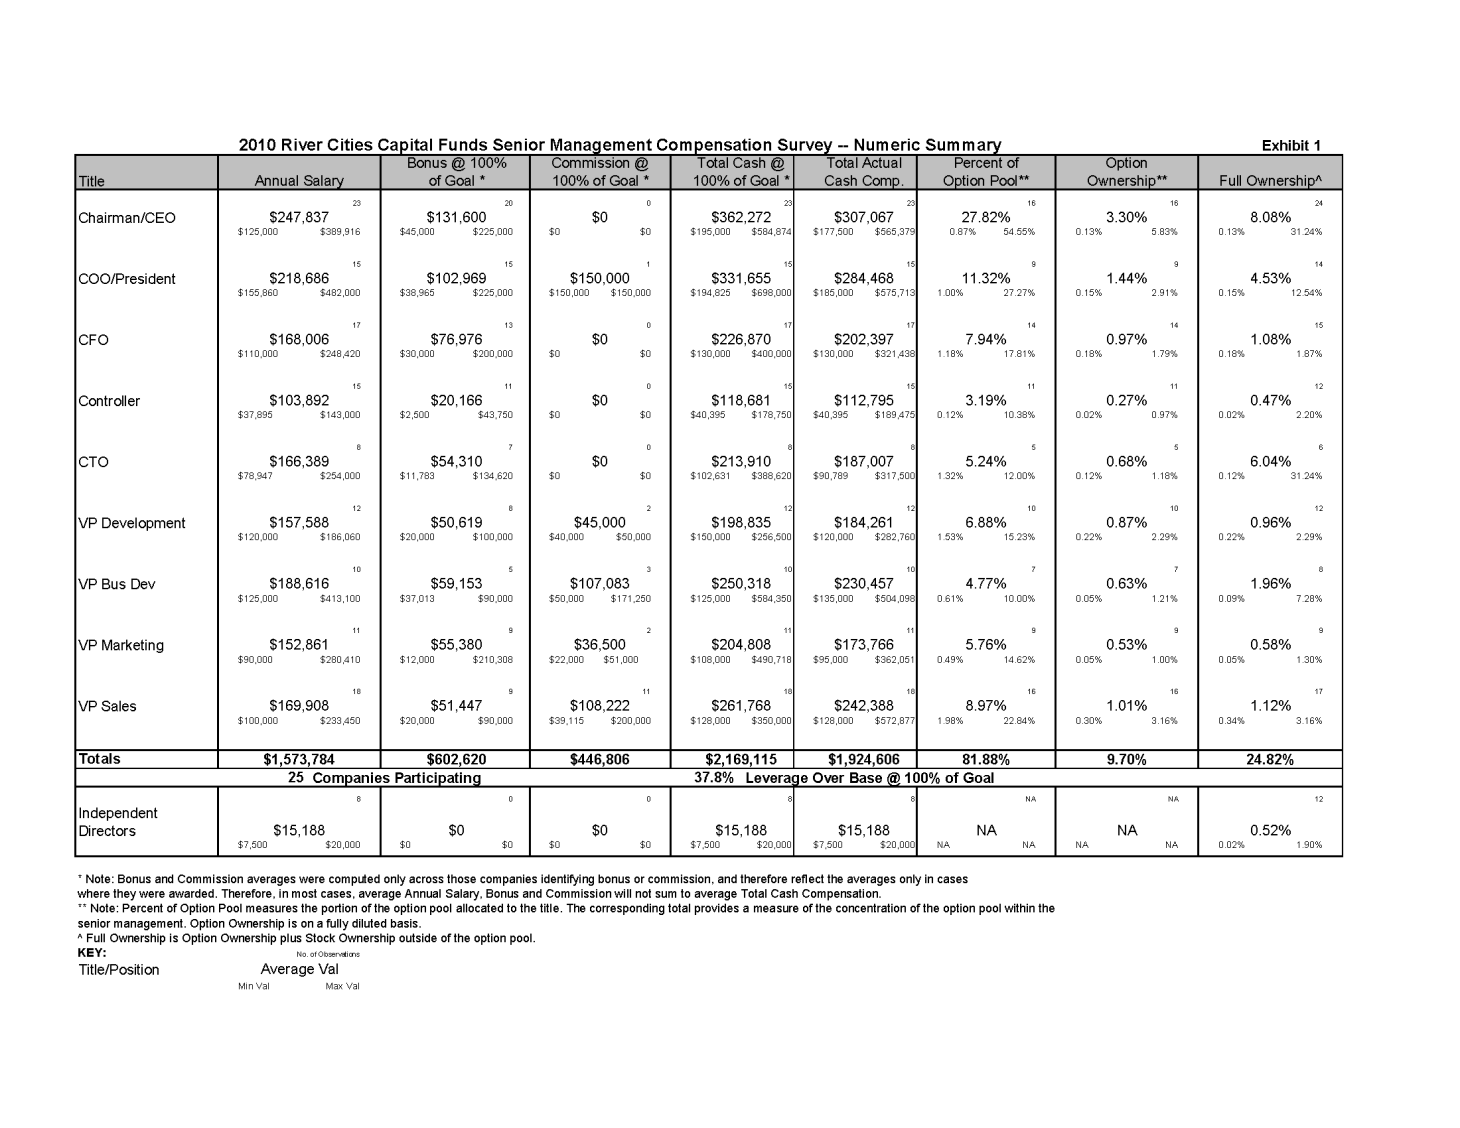
Exhibit 1 – Numeric Summary.
Here are just a few interesting observations from the Summary:
-
- On average, CEOs have a base salary of $248K, target bonus of $132K and 3.3% in options (or 28% of all options granted).
- Actual bonuses and commissions paid provided an average of 22% leverage over base salaries, against a target of 38% leverage at 100% bonus and commission.
- On average, the VP of sales had the most leverage over base salaries at 43%, followed by the COO and CEO at 30% and 24% respectively.
- On average, option pools accounted for 10% of fully-diluted ownership for the senior management.
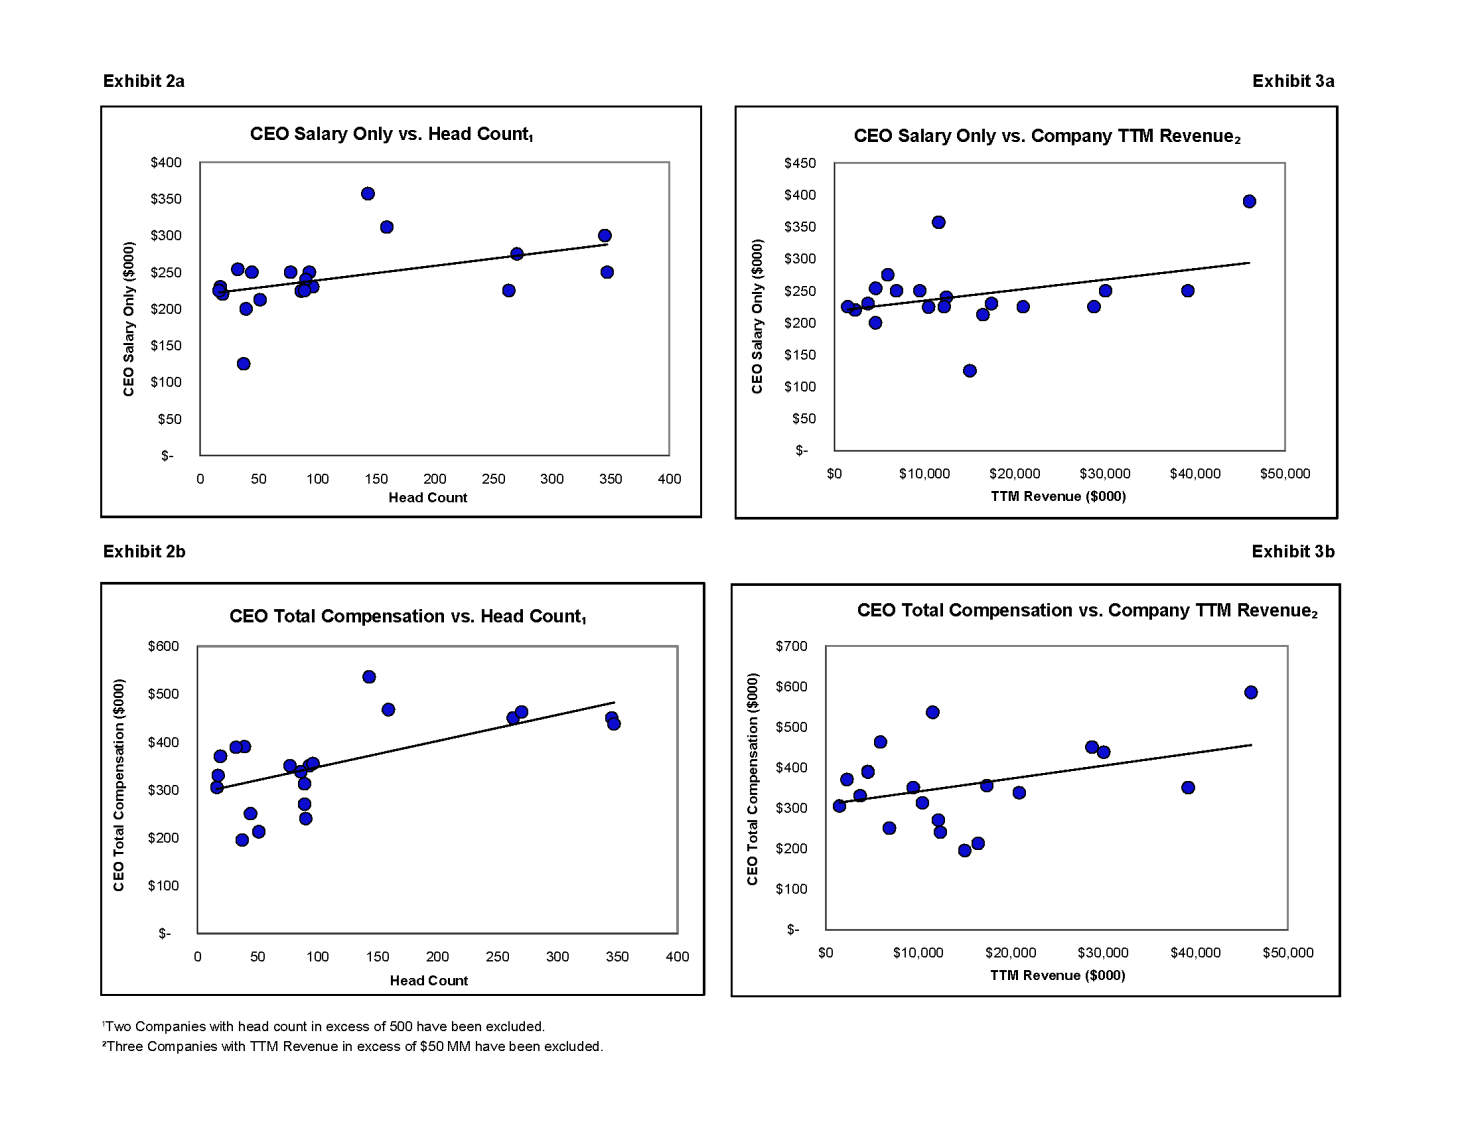
Exhibit 2 – “CEO Compensation versus Company Head Count” Graphs.
The analysis shows that CEOs who manage more people tend to receive more salary, but not dramatically so.
Exhibit 3 – “CEO Compensation versus Company TTM Revenue” Graphs.
The analysis shows that CEOs who run companies with more revenue tend to receive more compensation, but similar to the comparison to head count, the relationship is weak.
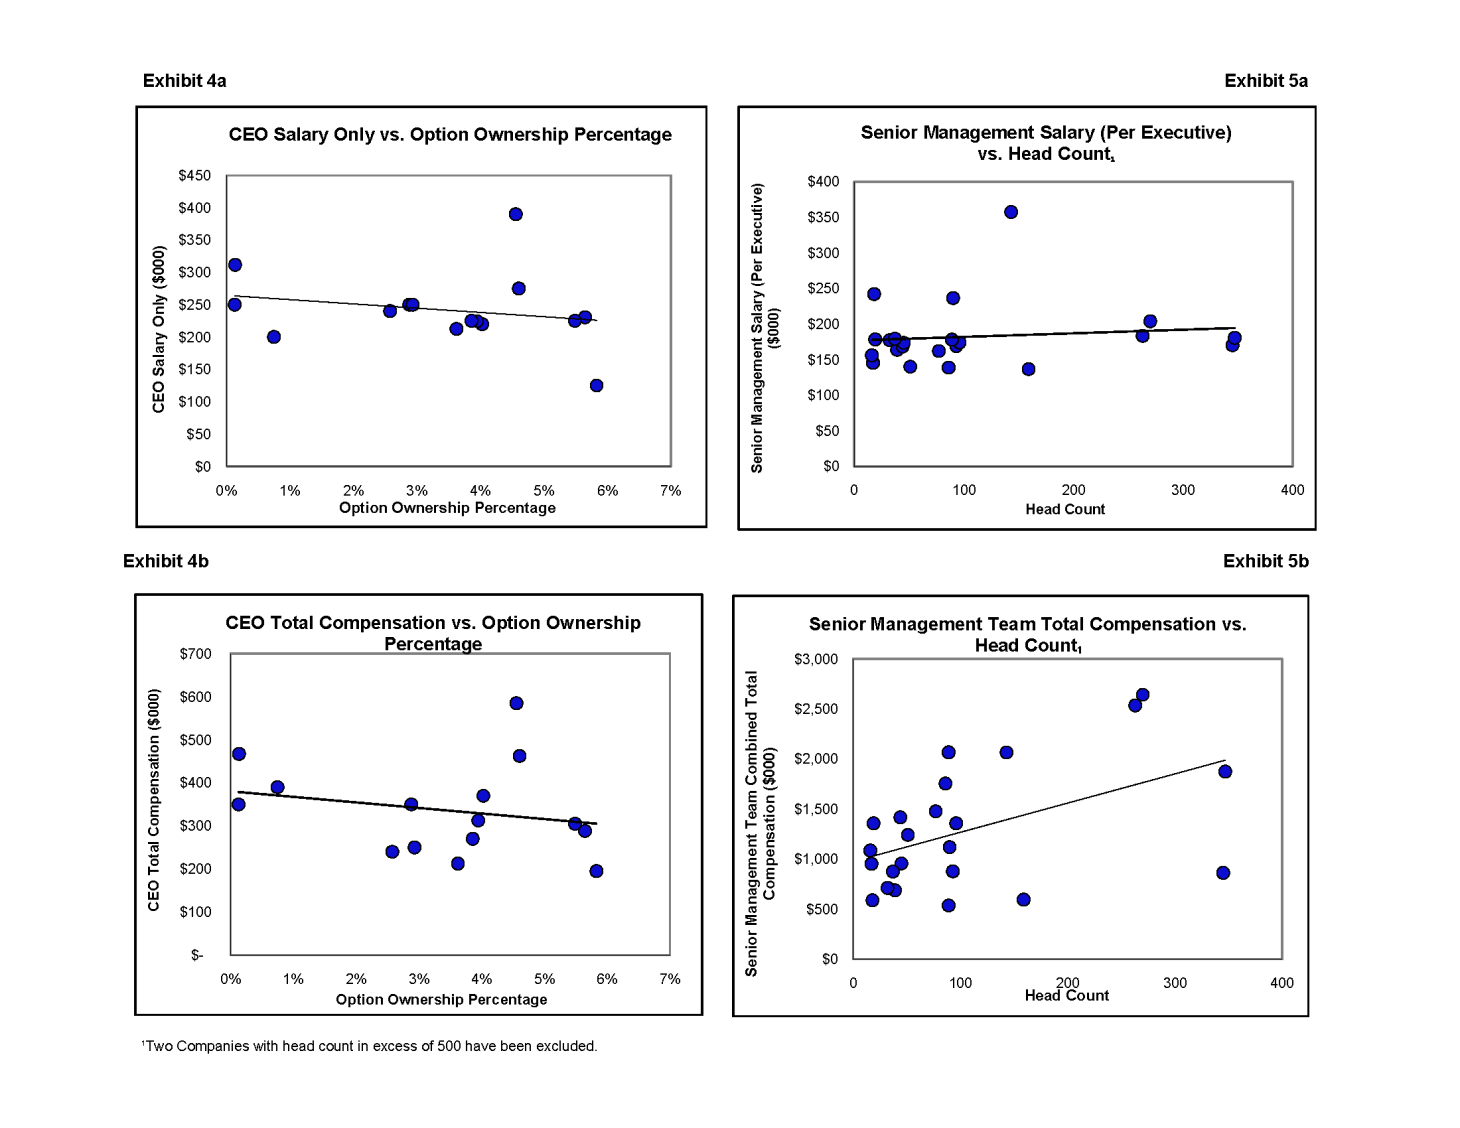
Exhibit 4 – “CEO Compensation versus Option Ownership Percentage” Graphs.
The analysis shows that CEO’s with less compensation tend to receive more options, but the relationship was very weak.
Exhibit 5 – “Senior Management Compensation versus Company Head Count” Graphs.
The analysis shows that large companies (measured by head count) tend to receive higher compensation for the management teams taken as a whole. Further the analysis did not show any meaningful relationship between senior management salary (per senior executive) and the size of the respective company. (measured by head count)
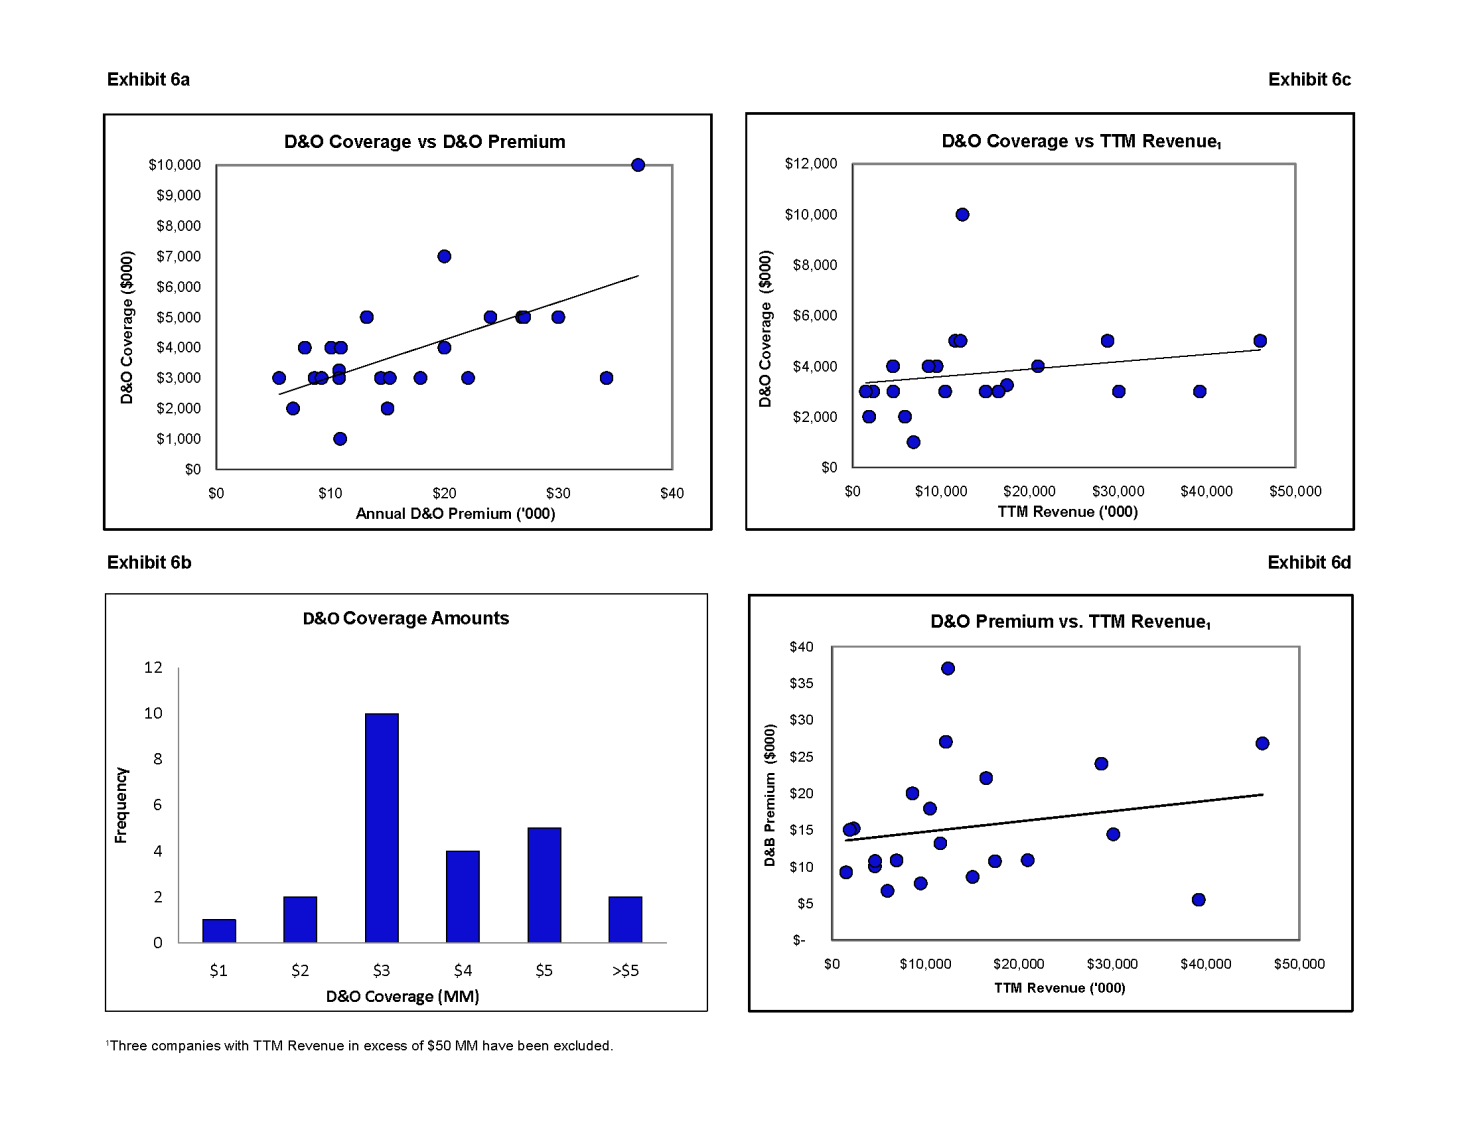
Exhibit 6 – “D&O Coverage and D&O Premium” Graphs.
The analysis shows a strong relationship between size of D&O Coverage and the D&O Annual Premium with few variances. The most popular coverage amount is $3 MM, with 10 companies choosing that amount. The analysis also shows companies with higher TTM Revenue have slightly higher coverage and premiums.
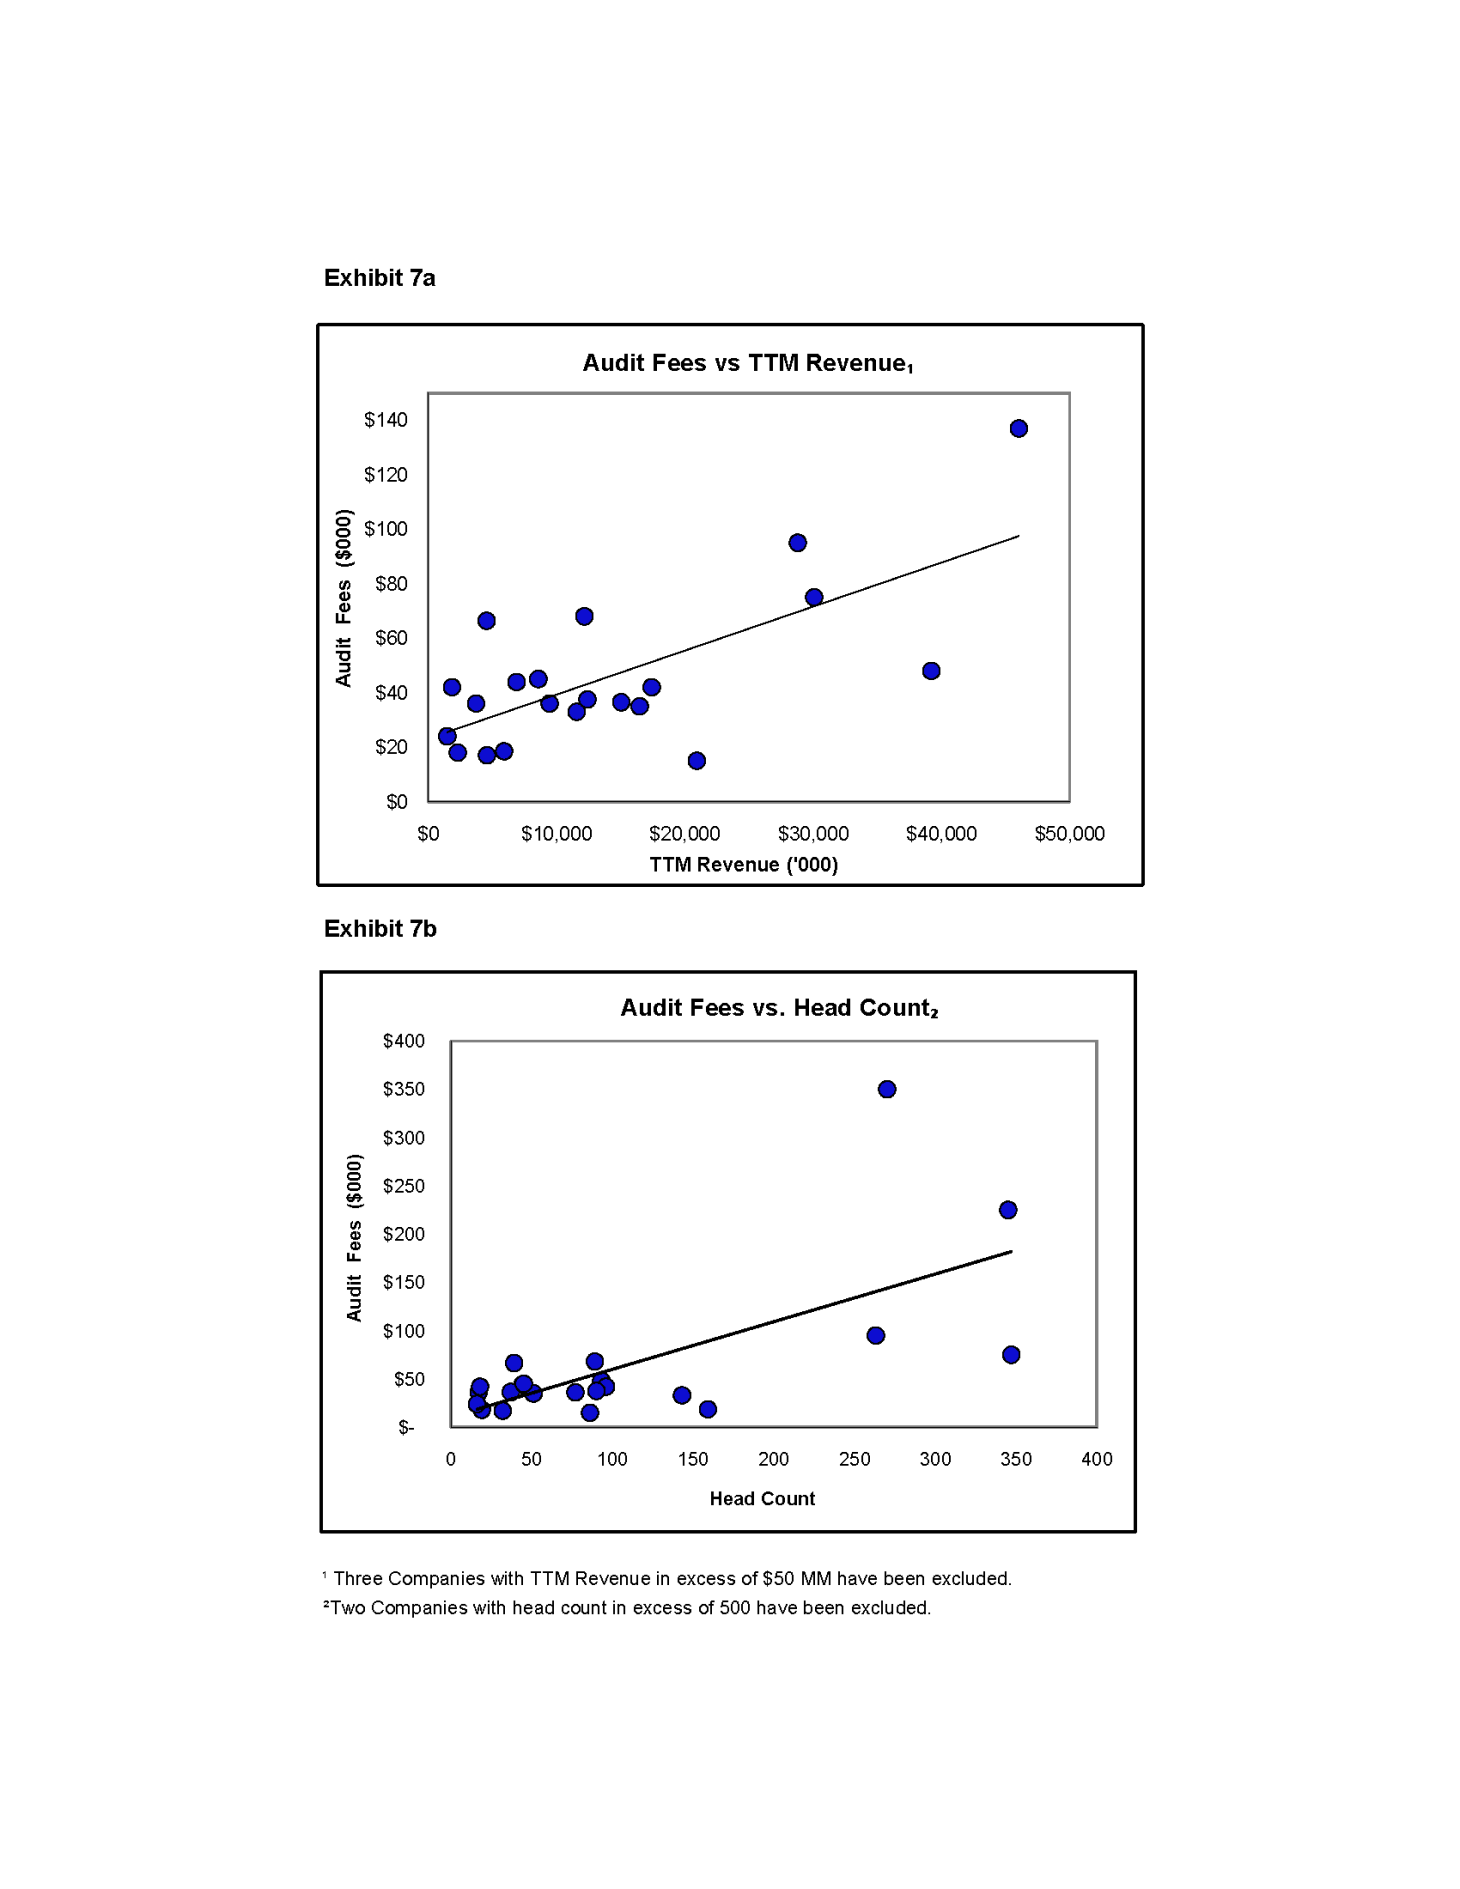
Exhibit 7 – “Audit Fees” Graphs.
The analysis shows that companies with higher revenue and head count tend to have higher Audit Fees.
Out of the sixteen companies with independent directors, eight compensate with options only; four compensate with both cash and options; and four compensate with cash only. The average option and cash compensation were at 0.5% (options on a fully diluted basis) and $15K per director per year, respectively. For further information about this report, please contact Parag Rathi; more detailed is available for interested managers.